
I’ve written some about Charting, and I’ve written about JSON. I realized I like working with these tools. It recently dawned on me, thanks to a conversation with Todd, that I could combine the two together into “FileMaker JSON Charting”.
So, I laid in the floor of my loft while the dogs happily chewed on bones or toys and worked through it. I tried to think of how JSON could work with a chart.
It took a bit, but I started with the idea that a chart needs a list of values for the x- and y-axis. And a chart needs its two lists to match up line by line. Read the previous posts for more detail.
I realized JSON is the PERFECT structure to keep the lists intact. I can create an array of JSON objects with the attributes: “month”, and “sales”.
{
"lineChart" :[
{
"month" : "January",
"sales" : 50
},
{
"month" : "February",
"sales" : 3
},
{
"month" : "March",
"sales" : 0
},
…
]}
If I could somehow pull the values out of each item in the array, I could easily create a list and put it in the correct axis. It turns, out we have a custom function that will help with this:
JSON.GetValuesAtPath(array, path). found in our JSONAdditions.fmp12 file.
This function “returns a list containing only the values at that path”.
So I could do:
Let (
_array = JSONGetElement ( zSystem::JSON ; ".lineChart" );

JSON.GetValuesAtPath( _array ; "sales")
)
and get “50¶3¶0” in return.
Look. It’s a list. It is easily stuffed into the y-axis. For the x-axis I can use the same calculation as above, but take out “sales” and put in “month”. Easy easy easy.
Expansion
It occurred to me during the JSON object creation process that I could add another attribute and use the new attribute in another chart:
{
"lineChart" :[
{
"dollars" : 415,
"month" : "January",
"sales" : 50
},
{
"dollars" : 22.8,
"month" : "February",
"sales" : 3
},
{
"dollars" : 0,
"month" : "March",
"sales" : 0
},
…
]}
So chart 1 works with month and sales attributes. And Chart 2 works with “month” and “dollars” attributes. Two charts for the price of one JSON object, AND they stay in sync.
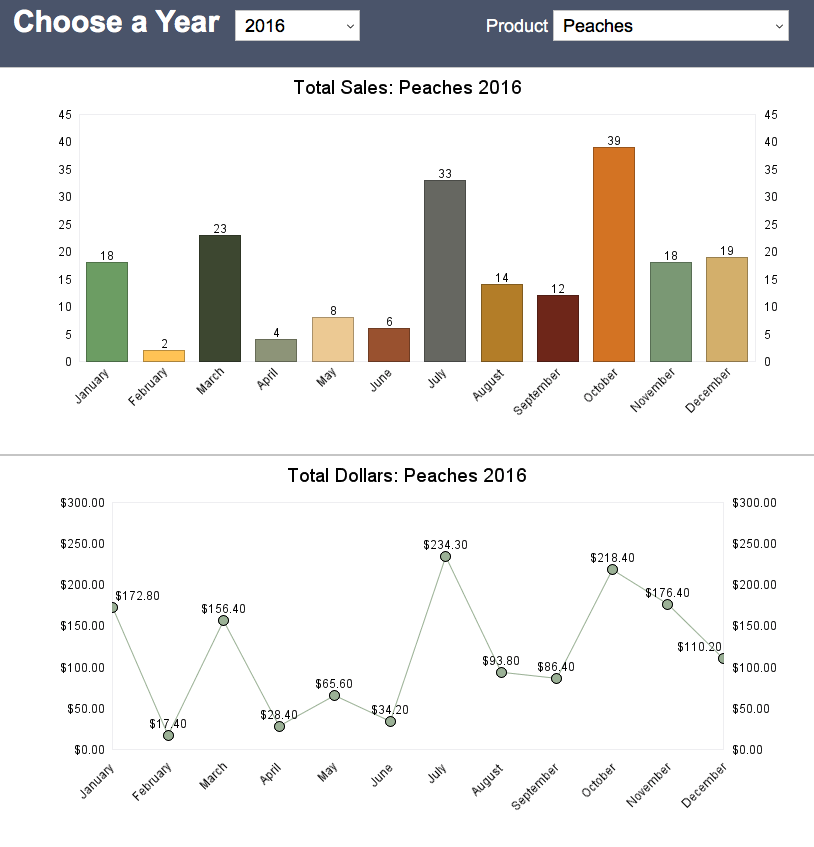
Two charts for the price of one JSON object
That’s very cool. In fact, as I drifted off to sleep, I remembered there are JavaScript libraries that do this same thing. They are designed to pull from different attributes of the same JSON object.
So my main task became gathering the data from the fields into the array and, as you see above, placing it in a field.
Generating the Data
I won’t go into a lot of detail about the method I used to generate the data. You can see it in the download. Here are the highlights:
- Find the records with the matching year and product.
- Gather the JSON data in some format. I’m looping through the records and creating objects which will go into an array, but there are other ways.
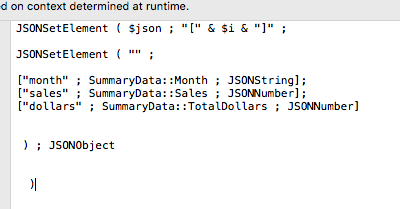
Collecting data into an array
- Update the existing JSON object in the correct path. In my case: “.lineChart”.
Ever Expanding
I can expand the idea of FileMaker JSON Charting. A JSON object is useful for holding the data necessary to fill out a chart. A JSON object can have many parts to it. The line and column chart above run off of the “lineChart” nested array. I realized I could have another nested array for another chart: “pieChart”. In fact, it occurred to me one JSON object could run an entire dashboard, including a virtual list! Woo!
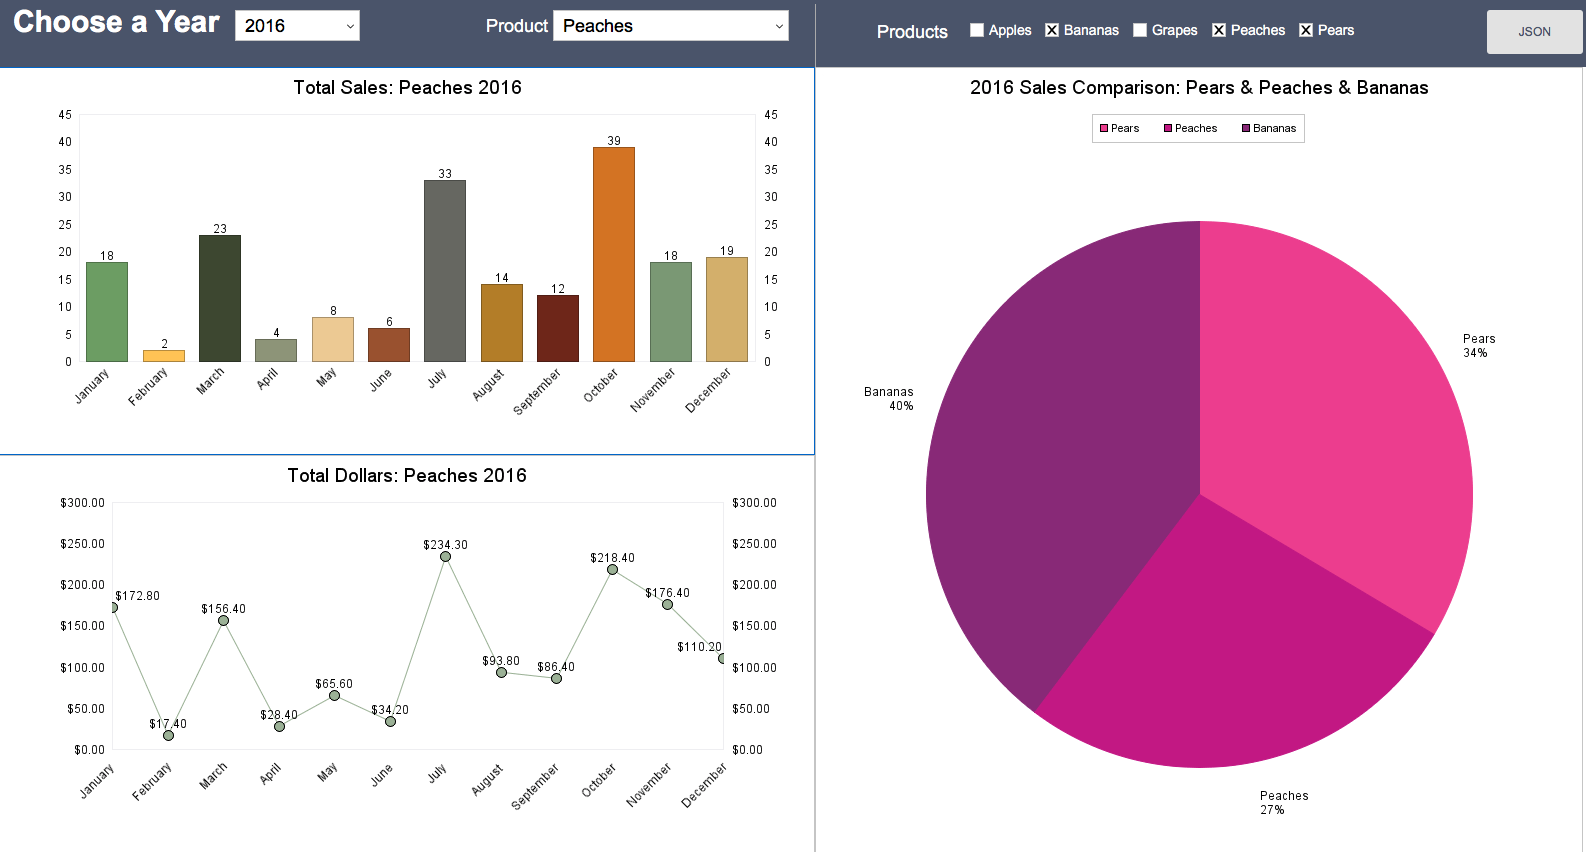
An entire dashboard powered by one JSON object.
This dashboard runs off of one JSON object. The JSON object contains a nested array for “pieChart”, and one for “lineChart”.
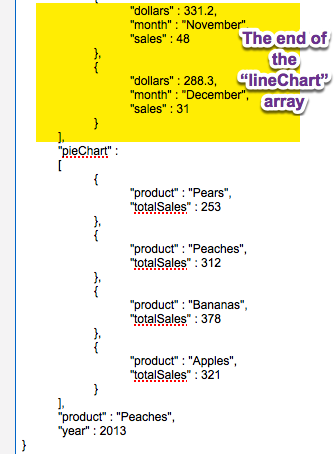
The JSON object
The Year field at top left determines the data to be shown, so the JSON object is re-rendered each time. And the additional choices at top further refine the data displayed.
Updating the Data
My scripting gathers the data and then overwrites what’s already in the JSON object with new data. So if a user chooses 2016 and “Peaches” whatever is in the “lineChart” key will be replaced with new data. This is useful. I don’t wipe out other data that is powering other charts.
FileMaker JSON Charting Further Considerations
I woke up in the morning and, as often happens, an idea popped into my head. I could set up my JSON object to collect data for the entire range of years and products and refine the calculation for each axis in the charts to drill down to the path for the year and the product the user chose above. No re-capturing of the data.
But why would I do all this? I could very easily create many table occurrences and filters and such to display the same data. I think that answers my question. These charts are completely context-free. the JSON is stored in a field (or could be in a global variable) and available no matter where the objects happen to be.
Again, JavaScript libraries do this: ‘reduce’ and filter from a huge JSON object to what is needed for a particular chart.
I’m sure there’s some more that can be done here. I’ll continue to play with it and see what else I come up with, but if you’ve got any ideas, let me know in the comments below.
Hi Jeremy,
You had helped me a year or so ago doing some C3 charting, I was actually getting pretty dangerous with it. However, I haven’t done much with it since the initial go around with so I am having to basically start over. Viewed you video that you’ve done here at Geist, I was wondering if you have anything current on gathering the data to be used be used as a data source for the C3 chart. Just looking to do some straight forward bar charts.In viewing this video “JSON as a data source” it looks like the alternate approach you mentioned at the end of the video might be a viable approach. I was just starting to go through the scripts used in some of your older examples using execute sql, there again I would have to ramp up again. Any suggestions on a direction?
Al
al_delgado@cox.net
Hi Jeremy,
I replicated you solution in my application, everything seems to be working except for the last Set Field, Set Field [zSystem::JSON; JSONFormatElements ( JSONSetElement ( zSystem::JSON ; “.lineChart” ; $json ; JSONArray ) )], do I have to define the “.lineChart” somewhere? Not sure how the JSONSetElement works.
Hi.
What this script step is doing is simply setting the .lineChart property in the JSON with an array of the data. It overwrites whatever was there and instead adds new data. So you shouldn’t have to do anything to define a line chart. However, the lineChart property must be extracted out for one of the charts.
In the that last step nothing gets set in zSystem::JSON, however the correct values are in $json. Where is the .lineChart property defined or is it just there, not familiar with JSON.