
Every day it seems, on the FileMaker Community, someone asks about how to work with FileMaker Charting. This question usually comes when I’m walking a dog, so I have to stand there on the corner and try to answer on my phone while my pup does his thing.
Setting up a chart using the chart object can be quite confounding until the day it isn’t. And once it is easy to understand you’ll never forget how to use it. It’s like riding a bike or something else that you never forget. While this might not be a ‘boss-level’ technique, it is still worth getting to know.
So we are going to focus our attention on the chart object so that you can create a chart in relatively short amount of time. In this post, we’ll take a look at the foundation of the chart object: the data and how to gather it. In the past, there’s been some great documentation about it. But I’d like to zero in on the data gathering only. The rest you can read in the white paper.You can download the demo (below) and review the video.
Understand the FileMaker Charting Object
FileMaker chart objects will render a returned-delimited list of data in a visual way. That’s all you need to know. If you can pass a list to the x-axis and a matching one to the y-Axis (as applicable), then you can display data on a chart. It is really that simple.
These are valid for the chart.
There are some caveats:
- The data in the x- and y-axis must match exactly. If you have four colors in a list in the x-axis, you must have four values in the y-axis with corresponding values.
You can use an empty value but it must be in the correct spot in the list. I would recommend actually using a 0 instead of an empty value.
Here’s an example:
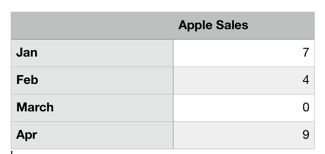
A chart of some data. What do you see missing?
Your list must match exactly:
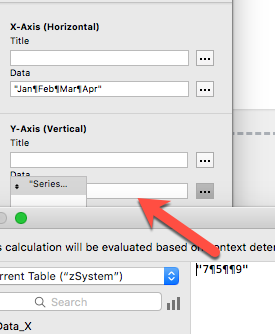
X-axis: “Jan¶Feb¶Mar¶Apr”
Y-axis: “7¶4¶¶9”
Or this:
X-axis: “Jan¶Feb¶Mar¶Apr”
Y-axis: “7¶4¶0¶9″
These are correct because there are four values in the list. Each value in the y-axis corresponds to a value in the x-axis.
This would be incorrect:
X-axis: “Jan¶Feb¶Mar¶Apr”
Y-axis: “7¶4¶9”
There is a missing value, the sales amount for March. In this case, the 9 would apply to March and April would be missing a value.
I must clarify that most of the charts in the object require an x- and y-axis, but not all. The pie chart requires “Category Labels” and “Slice Data”, but they’re basically the same thing.
Making a list/Checking it Twice
Now we just have to collect the data into a list, and that is done in a myriad of ways. Let’s take a look at them by first reviewing the three data sources of the FileMaker Charting object. In the Data Source tab, there are three options we can use. Let’s examine each one.
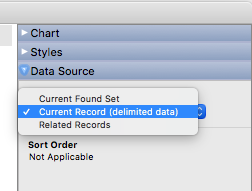
The Data Sources of FileMaker Charting
And let’s examine it within the context of a table called SummaryData.
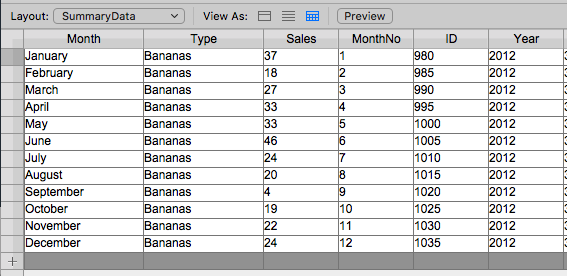
The summary data we will chart.
This table holds the total sales for different product types ( Apples, Bananas, Grapes, Peaches, Pears) for each month of a year (2010-2017). We’ll use this data as much as we can throughout the examples.
Current Found Set
Individual Record Data
Current Found Set: Individual Records
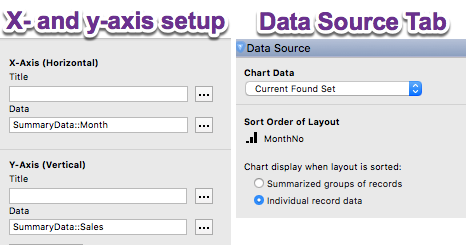
It is often the case that we want to build a chart to display some data from the found set. For example, if we wish to display the total sales for a particular fruit for each month, we can use this data source option.
This option (as shown above) will display on the chart all of the values of of a field for the x-axis and y-axis in the sort order of the records.
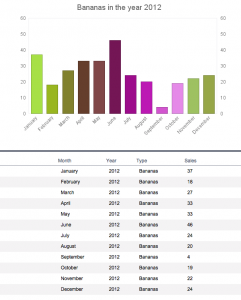
A chart displaying the records in the found set
This chart shows the list view of the found set. I’ve placed the chart in the header part of the layout, but I don’t have to have the fields on the layout. This could be a simple form view with just the chart and buttons / fields with global storage for scripted finds.
This current found set option will respect the sort of the found set. If I change the sort from a monthNumber field (not displayed) to the Month field, the chart would update once the sort is finished.
And to address an earlier point, if one of these summary records had zero sales for a month, I would fill that sales field with a big fat 0 so it the value ‘shows up’ on the chart and the remaining values line up with their respective months.
Summarized Groups of Records
Current Found Set: Summarized Records
We can also visualize the data as we would do on a subsummary report.
Here’s a traditional subsummary report. This one has the body part removed and is just showing the sub summary sections.
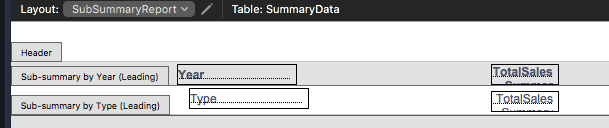
A typical Sub Summary set up
Within each sub summary part, I can place a chart. The chart summarizes the data in the group just below it, exactly as the sub summary part does.
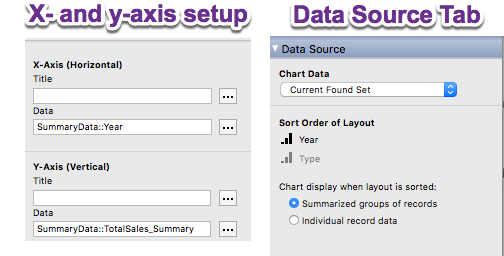
Here’s the chart in the header, and is set up to include the Year in the x-axis, and a summary field (total of sales) in the y-axis. (the picture below shows a graphical bug in the chart set up in High Sierra. Arg!)
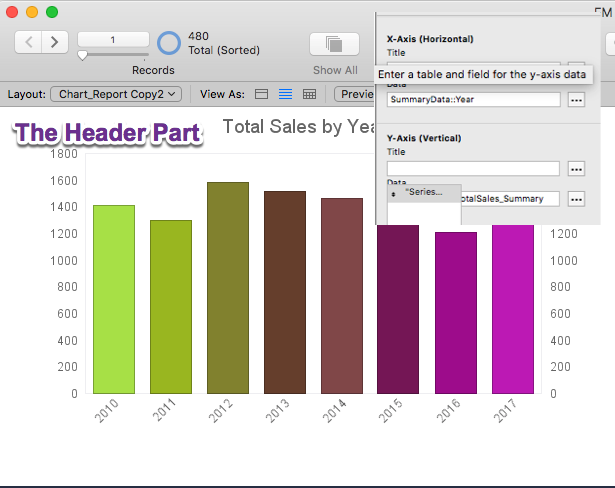
A chart in the header
In the Year sub summary part, another graph is placed, and it summarizes the each type’s sales for that year.
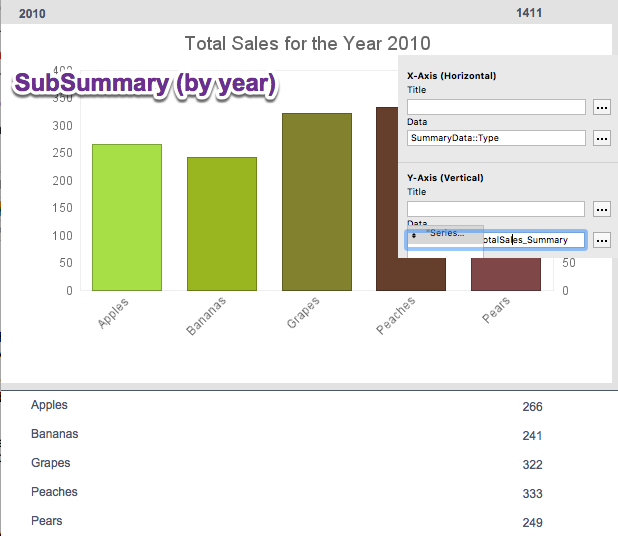
A chart placed in the sub summary part
The current found set data source is a flexible way to pass a return-delimited list of data to the chart object. The options allow us to choose what to send to the chart: fields in actual values or summary information, as a sub-summary report shows. You can get a lot of mileage with this option, so consider it carefully.
How to Collect the Data
Since this chart displays the current found set, we simply have to find and sort the records for our liking. That’s it.
In the next post, we’ll look at the other two data sources of the FileMaker Charting object: Related Records and Current Record (Delimited Data).
I haven’t tried to use charting for quite awhile. Thanks for this demo and write-up – helped me get back on track fast!